This view appears when starting the model.
From now on the program is mostly mouse-operated.
Depending on the location of the mouse there are a number of operations that can be performed using the mouse buttons (more information below).
If you press on the button start model, you will derive a new view, with a blue and a green button. You can choose to view the variables of the lake or the lake managers (farmers).
If you have chosen the lake, you will get a view that contains closed boxes of the most important variables.
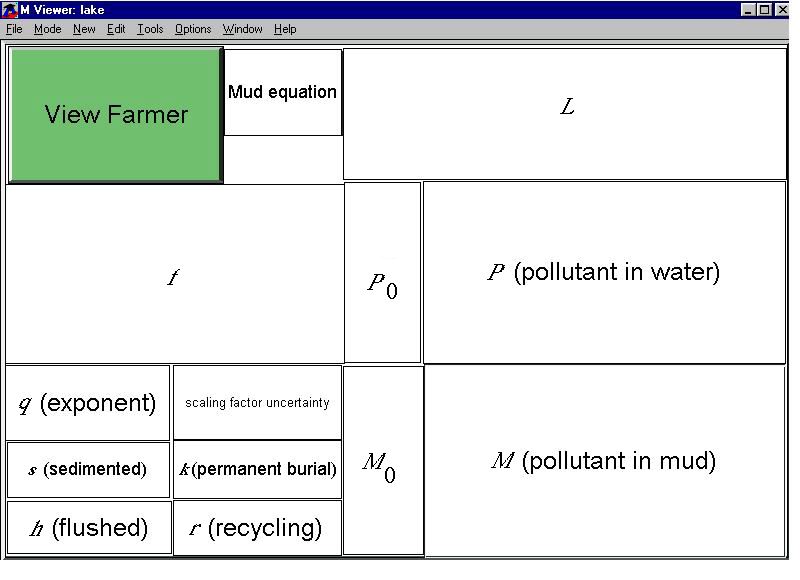
You can open the boxes if you put the mouse cursor at the empty space below "Mud equation", push the right button of the mouse, and "open all". Note that the horizontal axis represents time. In the default case, the model ran 100 years, but this time horizon can be expanded by Options -> Model -> Max:
The variables listen in the view are:
L = the input of phosphorus in the lake
q (exponent) = affects the steepness of the sigmoid curve
scaling factor uncertainty = sf in the paper, the higher the more random influence on the input of phosphorus in the lake
s (sedimented) = proportion of P sedimented each year
k (permanent burial) = a small portion of the phosphorus in the mud is lost each year to permanent burial
h (flushed) = the proportion of P flushed each year
r (recycling) = maximum recycling rate of phosphorus
P = amount of phosphorus in the water
P0 = phosphorus value at t = 0
M = phosphorus in mud
M0 = initial value of M
f = value of sigmoid curve
Mud equation = one can exclude the mud equation of the biophysical system
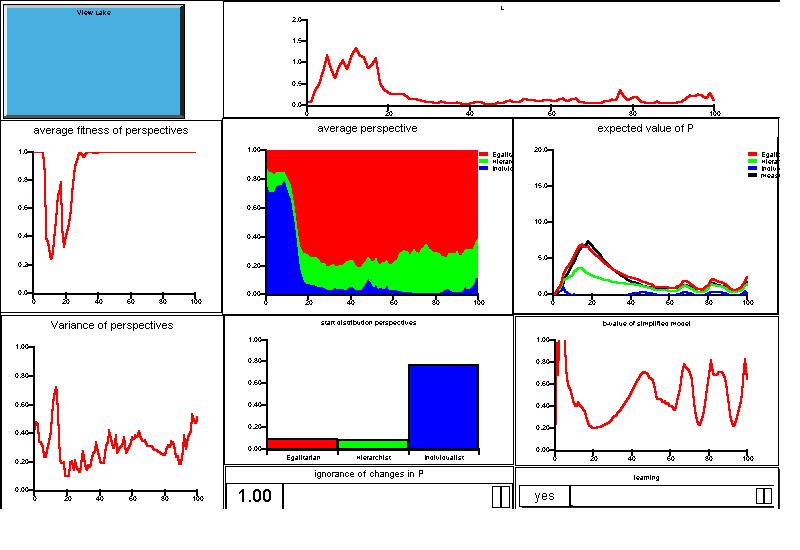
If you have chosen for the lake managers, you will view:
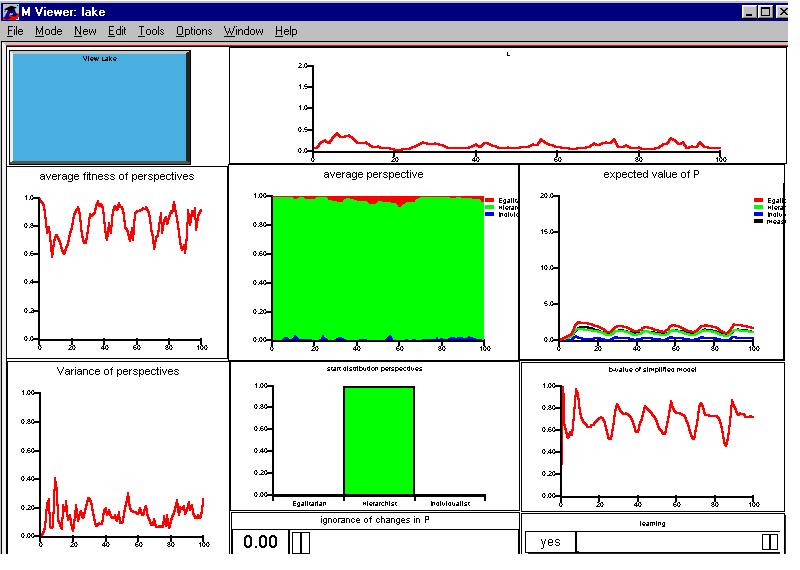
with the variables:
expected value of P = according to the various perspectives compared with measured value
start distribution perspectives = allocation of perspectives at t = 0
b = constructed b value as described in the paper
ignorance of changes in P = the epsilon value as described in the paper
Average perspective = the distribution of the three perspectives
Average fitness of perspectives = the higher the fitness the better the perspectives explain the observations
Variance of perspectives = a measure of the variance of opinions
Learning = one can assume that agents do not learn; distribution of perspectives remain the same
An example of changing parameter values is given in the next view, in which the start distribution of perspectives is changed, leading to different results.
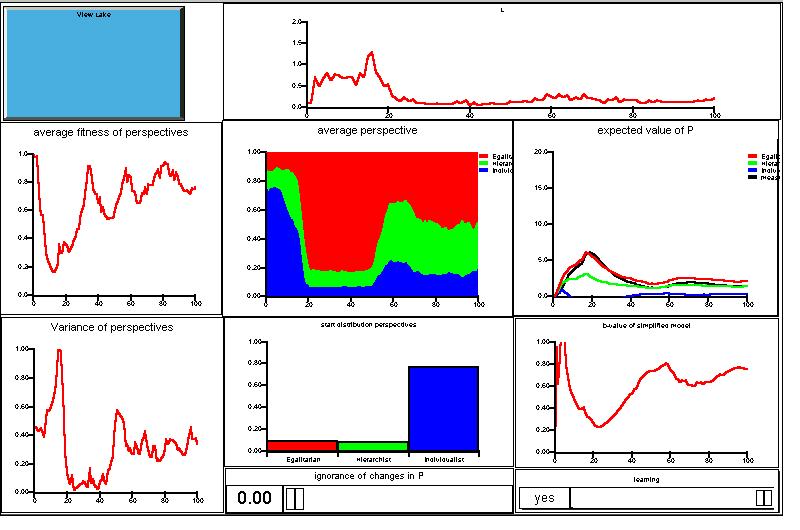
Suppose you enlarge the ignorance variable to 1.0; then the adaptation slows down.
Use of the mouse
At the menu bar at the top of the screen, a menu can be found with a number of specific items.
For using the software, the number of menu options has been restricted.
Below is a list of all menu items you can use. The other items cannot be used in this version of the software.
| Menu | Item | Action |
| File | Opens a menu to print the screen to printer or to a file | |
| Exit | Exits the model | |
| Tools | Scenario manager | For saving and opening input scenarios |
| Viewer Options | Freeze and rerun the model | |
| Help | About | Gives information about the version of the M-software used |
| Menu item | Action |
| Open | Opens a box |
| Close | Closes a box |
| Open all | Opens all boxes under the current level |
| Close all | Closes all boxes under the current level |
| Zoom in | Zooms in on a box and opens it |
| Zoom out | Zooms out from a box |
| Reset | Resets the contents of all boxes under the current level to their default values |
| Set reference | Set the value of all boxes under the current level of a reference level, which will remain visible when one or more of the values is/are changed |
| Unset reference | Removes all references of all boxes under the current level |
| Load ... | Loads data from a data file into a box |
| Save ... | Saves data from a box to a data file |
| Menu item | Action |
| Show value | Shows the location of the mouse pointer in XY coordinates. |
| Drag | Enables one to drag the graph to shift the scale of the X and / or Y-axis. |
| Scale X | Enables one to change the range of the X-scale. |
| Scale Y | Enables one to change the range of the Y-scale. |
| Edit free | Enables one to change the graph freely by dragging the line. |
| Edit line | Enables one to change (parts of the) graph linearly. |
| Edit expo | Enables one to change (parts of the) graph exponentially. |