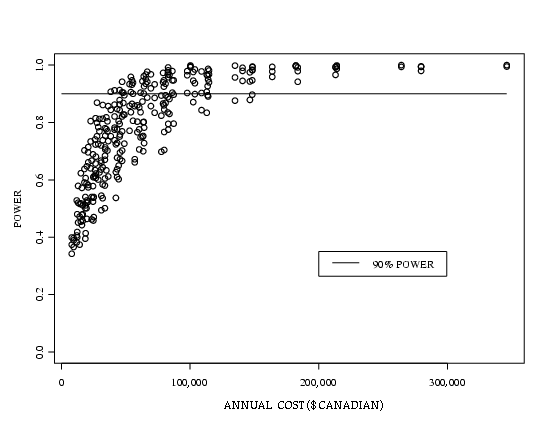
Fig. 7. Power to detect –3% per year exponential trends in Black-capped Chickadee abundance over 20 years vs. annual program cost. Each circle represents one of the 160 sampling designs evaluated (see Table 1). Power is estimated using Monte Carlo simulations; cost is estimated using a simplified cost model (Appendix 3).