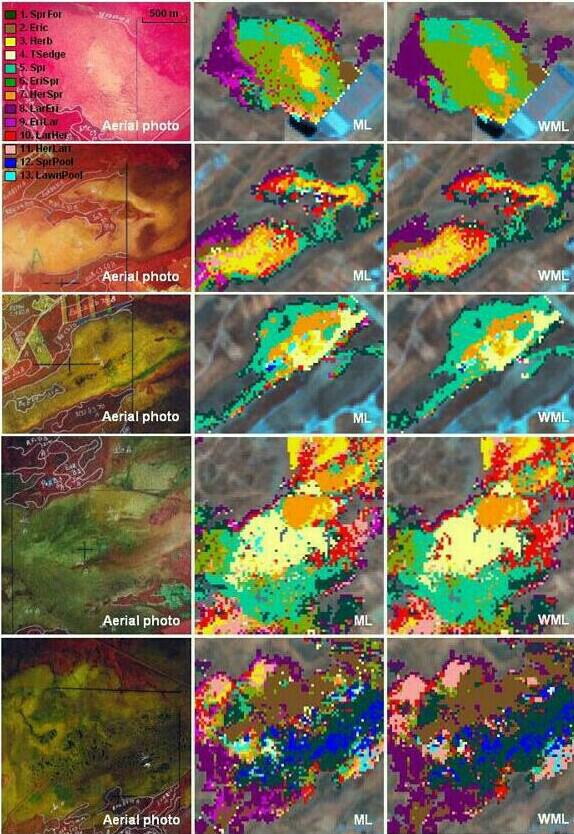
Fig. 1. Land cover classifications of five peatlands representing the 13 habitats defined a priori. Both the maximum likelihood classification (ML) and the maximum likelihood function (WML), which takes into account the proportion of each habitat class within a particular peatland, are shown for each peatland, along with their corresponding aerial photographs. Readers with some photo-interpreting skills will notice a relatively good correspondence between the patterns on the aerial photographs and the ones that emerged from the two classifications. Habitat codes are defined in Table 1; see Fig. 2 for the location of the five peatlands in the study region.