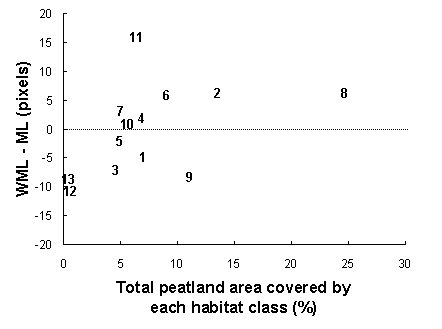
Fig. 4. Difference in accuracy between the maximum likelihood (ML) and the weighted maximum likelihood (WML) classification procedures as a function of habitat rarity. Negative numbers indicate that, for a specific habitat, well-classified pixels were less numerous for the WML procedure than for the ML procedure and vice versa. Rarity is expressed as the percentage of the total peatland area covered by each habitat class. Data points have been replaced by numbers referring to the habitat classes; see Table 1 for descriptions. Spearman correlation coefficient (rs) = 0.57, P = 0.043.