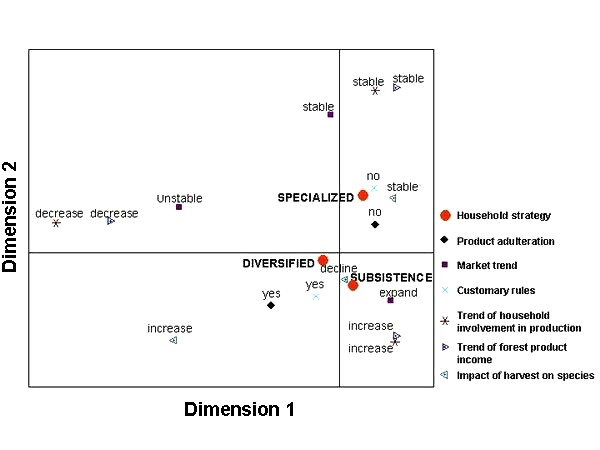
Fig. 2. A multiple correspondence analysis of key variables and household economic strategies.
Dimensions 1 and 2 account for 34% and 28% of the variance in the model, respectively.
The relative closeness of variable positions in the plot reflects their
tendency to be associated.