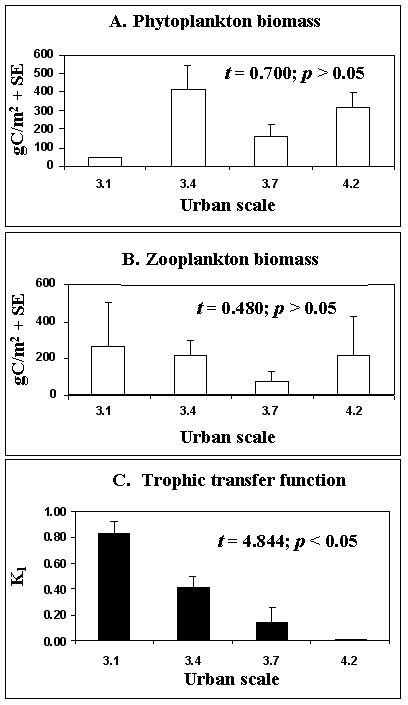
Fig. 7. (A) Mean phytoplankton biomass (mean ± 1 SE), (B) mean zooplankton biomass (mean ± 1 SE), and (C) mean trophic transfer function (mean ± 1 SE) at wetlands in each of the four study sites. Student t-tests were performed on pooled data from each typology, i.e., sites 3.1 and 3.4 together vs. sites 3.7 and 4.2 together, to test H0 of no difference between typological means.
The dark bars indicate that typological differences between watersheds with small town typologies and those with suburban typologies were significant. Light bars indicate that the difference between typological means was not significant.